UR Baseball (URB) hasn’t had an ideal start to its season. The team stands at 6–15, with a 4–10 Record in Liberty League play, putting it in a tie for seventh place of nine teams.
The underlying statistics validate that this team is very much a work in progress (all statistics are taken from before the team’s weekend doubleheader against RIT). Its winning percentage has actually been better than what its run differential would suggest (via pythagorean expectation), and scoring differential has been shown to be a better predictor of future performance in nearly every sport.
The team has had acceptable pitching, but its lack of offensive production has been a hefty problem. In Kenneth Massey’s online ratings, for example, the team ranks 266th out of 385 Division III teams in schedule-adjusted offense, though this is better than its rank of 339 in runs scored per game.
Because of the inherent strength of schedule factor (the ‘Jackets’ have faced a top-quartile slate of opponents thus far), it may be more useful to judge statistics versus other Liberty League teams.
As a whole, URB has an on-base percentage (OBP) that ranks seventh. Putting players on base is, of course, the only way to score, and a walk is just as effective as a single in that regard (although a single is often worth more since it can score runners from second base).
It’s difficult to have a good offense without at least a decent OBP, but it’s possible to make up for that shortcoming if a team can hit for power—going one for four with a home run is almost always better than going two for four for two singles—but this isn’t something the ‘Jackets have been able to do.
In fact, they’re ranked at the bottom of the Liberty League with a .331 slugging percentage (SLG), which is the standard measure for ability to hit for power. Aggregation of OBP and SLG gives OPS (on base plus slugging percentage), the classic metric of batter ability used since the late 19th century. Given the previous two rankings, it should come as no surprise that URB doesn’t have a strong OPS. The only other easily measurable factor of offense besides hitting is stolen bases, where the ‘Jackets rank seventh.
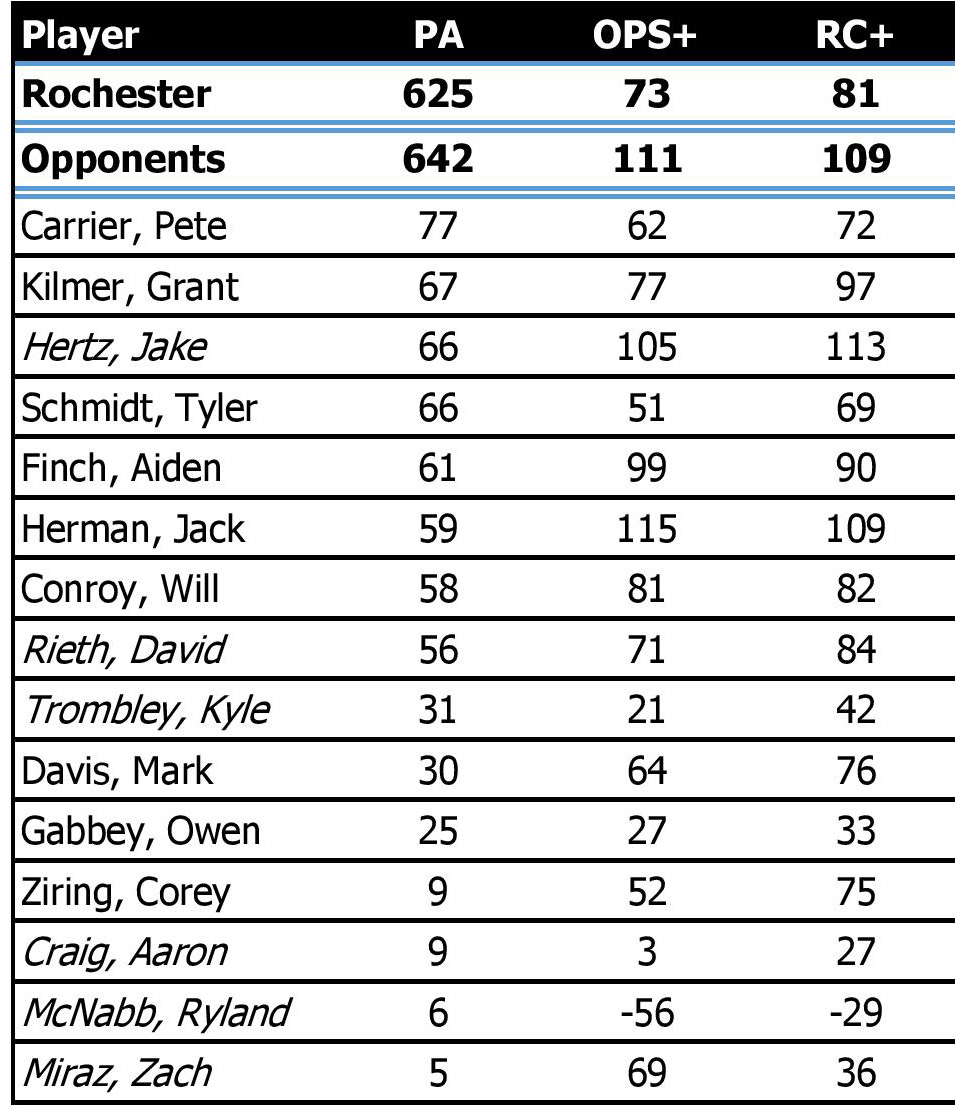
 The team does have a few standout performers on offense. The associated table shows the adjusted OPS+ and RC+ for each player. OPS+ is an index that indicates the percentage that a player’s OPS is above or below Division III average. RC+ is an index of the players runs created per plate appearance. Runs created is an estimate of how much each plate appearance would be worth on average in terms of runs based on calculated coefficients (e.g. a single may be worth 0.4 runs and a home run may be worth 1.4 runs). So RC+ is to runs created per plate appearance as OPS+ is to OPS. Strength of schedule should still be kept in mind, because it’s not adjusted for in individual statistics.
Though the team has a whole has a less than stellar 73 OPS+ and 81 RC+, freshman outfielder Jake Hertz and sophomore corner infielder Jake Herman have both graded as above average in both statistics. Sophomore outfielder Grant Kilmer and sophomore first baseman and catcher Aiden Finch are around league average as well in at least one of the the statistics. However, the rest of the team must do better than hitting 20-30 percent below league average across the board if the offense is to be an asset and not a vulnerability for the team.
On the pitching and defense side, the team has been far better, ranking in the top third of teams in Massey’s defensive ratings. In terms of the Liberty League, URB has been in the middle of the road across the board, ranking fourth through sixth in most major statistics including earned run average (ERA), fielding percentage, and most strikeouts and fewest walks per nine innings, as well as baserunners allowed (WHIP).
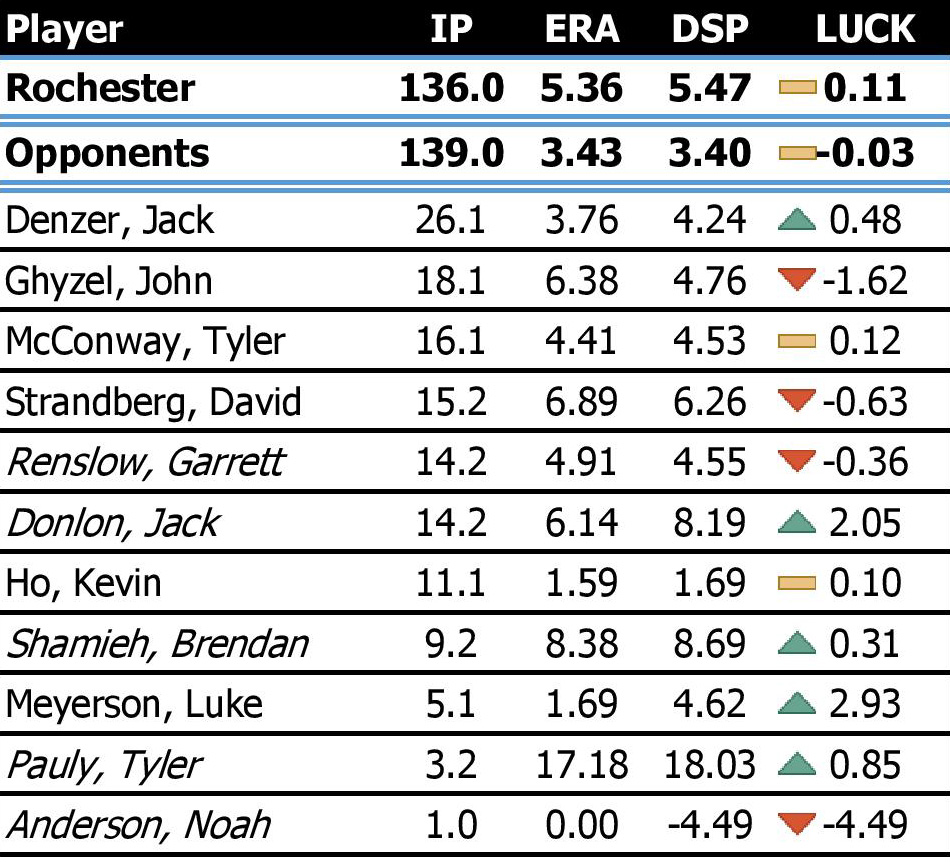
 The associated table shows the ERA and DSP for each Rochester pitcher. DSP is not an official statistic, much like RC+, but it can be thought of as the amount of runs created per nine innings allowed by the pitcher to opponent hitters. In this way, it can be used to estimate a pitcher’s “cluster luck”.
Cluster luck refers to how close together or spread out the hits allowed by a pitcher are. If a pitcher allows eight hits over six innings, it could be a successful outing or it could be a subpar one depending on if many of the hits were allowed in succession or if the pitcher got key outs when it mattered. But most analysts believe that much of this so called clutch hitting and clutch pitching comes down to luck, and this is what is assumed by DSP, or dispersion-adjusted runs allowed. So a pitcher with a much lower DSP than ERA is assumed to have bad luck, and vice versa.
Sophomore starter Jake Denzer has been a key member of the staff, with an excellent 3.76 ERA. His DSP of 4.24 still puts him well above league average, by nearly a run fewer allowed per nine innings. Fellow sophomore and reliever Kevin Ho has been lights out, with a sub-2.00 ERA and DSP. Keeping in mind that the league average ERA (and thus DSP) is 5.17, there are a lot of positives to be found.
One observation worth mentioning is that junior starter John Ghyzel, who has pitched the second most innings on the team, has been extremely unlucky and has allowed 1.62 more runs than expected. If he continues to pitch at the same level, the team can expect strong outings from him. Overall, however, the team’s ERA won’t improve substantially in the current state without external improvements, since its ERA and DSP are roughly the same.
In essence, the ‘Jackets play so far warrants their profile as a team with poor hitting and decent pitching, which means it may be a season for younger players to develop above all else.

